

Assistant For Traders
Get Start for Free Get Start for Free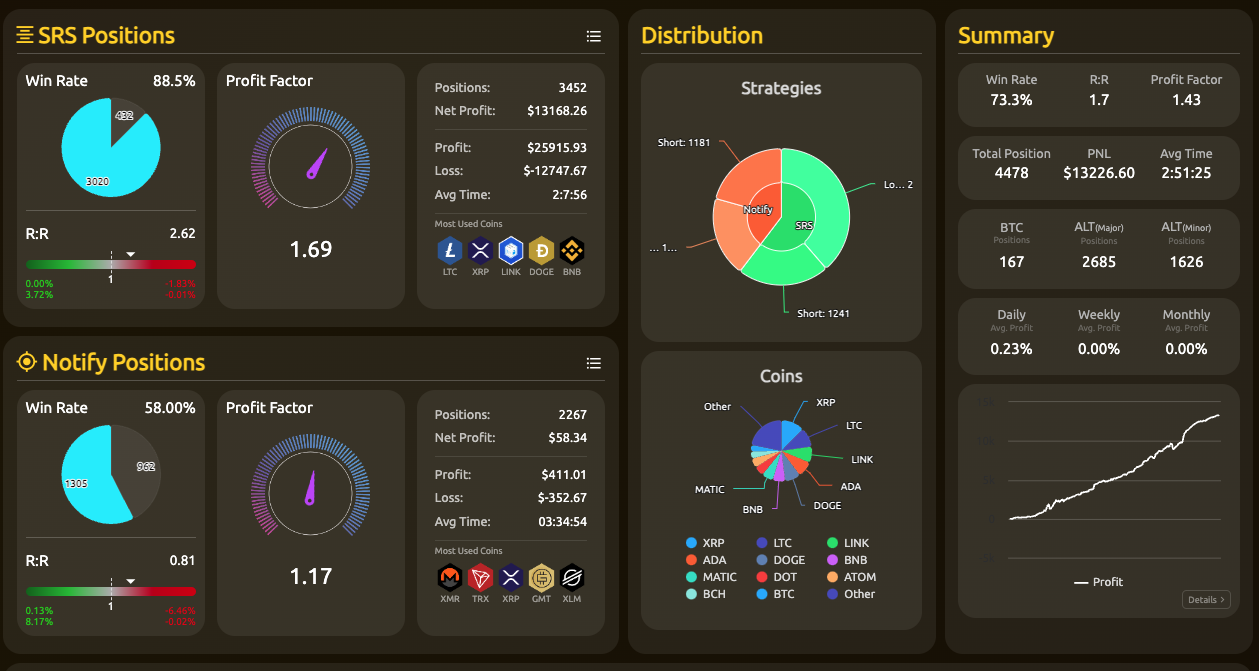
Last Closed Signals
Future
| RISK | HOLD TIME | BUY PRICE | STATUS |

|
2026-01-14
18:51
|
$3334.32 | SUCCESS |

|
----
|
---- | EXPIRED |

|
----
|
---- | EXPIRED |
SELL
PROFIT
DURATION
Future
| RISK | HOLD TIME | BUY PRICE | STATUS |
|
|
2026-01-13
04:05
|
$0.3875 | SUCCESS |
|
|
2026-01-13
14:36
|
$0.4017 | SUCCESS |
|
|
2026-01-13
22:10
|
$0.4186 | SUCCESS |
SELL
PROFIT
DURATION
Future
| RISK | HOLD TIME | BUY PRICE | STATUS |
|
|
2026-01-14
21:54
|
$944.770 | SUCCESS |
|
|
----
|
---- | EXPIRED |
|
|
----
|
---- | EXPIRED |
SELL
PROFIT
DURATION
Future
| RISK | HOLD TIME | BUY PRICE | STATUS |
|
|
2026-01-14
20:28
|
$0.4126 | SUCCESS |
|
|
----
|
---- | EXPIRED |
|
|
----
|
---- | EXPIRED |
SELL
PROFIT
DURATION
Future
| RISK | HOLD TIME | BUY PRICE | STATUS |
|
|
2026-01-14
19:20
|
$147.060 | SUCCESS |
|
|
----
|
---- | EXPIRED |
|
|
----
|
---- | EXPIRED |
SELL
PROFIT
DURATION
Future
| RISK | HOLD TIME | BUY PRICE | STATUS |
|
|
2026-01-14
17:50
|
$2.595 | SUCCESS |
|
|
----
|
---- | EXPIRED |
|
|
----
|
---- | EXPIRED |
SELL
PROFIT
DURATION
Future
| RISK | HOLD TIME | BUY PRICE | STATUS |
|
|
2026-01-14
18:53
|
$2.600 | SUCCESS |
|
|
----
|
---- | EXPIRED |
|
|
----
|
---- | EXPIRED |
SELL
PROFIT
DURATION
Future
| RISK | HOLD TIME | BUY PRICE | STATUS |
|
|
2026-01-14
20:01
|
$0.0123 | SUCCESS |
|
|
----
|
---- | EXPIRED |
|
|
----
|
---- | EXPIRED |
SELL
PROFIT
DURATION
Future
| RISK | HOLD TIME | BUY PRICE | STATUS |
|
|
2026-01-14
19:53
|
$3369.00 | SUCCESS |
|
|
----
|
---- | EXPIRED |
|
|
----
|
---- | EXPIRED |
SELL
PROFIT
DURATION
Future
| RISK | HOLD TIME | BUY PRICE | STATUS |
|
|
2026-01-14
18:17
|
$940.430 | SUCCESS |
|
|
----
|
---- | EXPIRED |
|
|
----
|
---- | EXPIRED |
SELL
PROFIT
DURATION
Future
| RISK | HOLD TIME | BUY PRICE | STATUS |
|
|
2026-01-14
16:56
|
$2.258 | SUCCESS |
|
|
2026-01-14
18:32
|
$2.226 | SUCCESS |
|
|
----
|
---- | EXPIRED |
SELL
PROFIT
DURATION
Future
| RISK | HOLD TIME | BUY PRICE | STATUS |
|
|
2026-01-14
17:50
|
$0.4181 | SUCCESS |
|
|
2026-01-14
18:35
|
$0.4119 | SUCCESS |
|
|
----
|
---- | EXPIRED |
SELL
PROFIT
DURATION
Spot
| RISK | HOLD TIME | BUY PRICE | STATUS |
|
|
2026-01-14
22:56
|
$2.215 | SUCCESS |
|
|
----
|
---- | EXPIRED |
|
|
----
|
---- | EXPIRED |
SELL
PROFIT
DURATION
Spot
| RISK | HOLD TIME | BUY PRICE | STATUS |
|
|
2026-01-14
21:54
|
$944.770 | SUCCESS |
|
|
----
|
---- | EXPIRED |
|
|
----
|
---- | EXPIRED |
SELL
PROFIT
DURATION
Spot
| RISK | HOLD TIME | BUY PRICE | STATUS |
|
|
2026-01-14
20:28
|
$0.4126 | SUCCESS |
|
|
----
|
---- | EXPIRED |
|
|
----
|
---- | EXPIRED |
SELL
PROFIT
DURATION
Spot
| RISK | HOLD TIME | BUY PRICE | STATUS |
|
|
2026-01-14
17:50
|
$2.595 | SUCCESS |
|
|
----
|
---- | EXPIRED |
|
|
----
|
---- | EXPIRED |
SELL
PROFIT
DURATION
Spot
| RISK | HOLD TIME | BUY PRICE | STATUS |
|
|
2026-01-14
19:53
|
$3369.00 | SUCCESS |
|
|
----
|
---- | EXPIRED |
|
|
----
|
---- | EXPIRED |
SELL
PROFIT
DURATION
Spot
| RISK | HOLD TIME | BUY PRICE | STATUS |
|
|
2026-01-14
18:17
|
$940.430 | SUCCESS |
|
|
----
|
---- | EXPIRED |
|
|
----
|
---- | EXPIRED |
SELL
PROFIT
DURATION
Spot
| RISK | HOLD TIME | BUY PRICE | STATUS |
|
|
2026-01-14
16:56
|
$2.258 | SUCCESS |
|
|
2026-01-14
18:32
|
$2.226 | SUCCESS |
|
|
----
|
---- | EXPIRED |
SELL
PROFIT
DURATION
Spot
| RISK | HOLD TIME | BUY PRICE | STATUS |
|
|
2026-01-14
17:50
|
$0.4181 | SUCCESS |
|
|
2026-01-14
18:35
|
$0.4119 | SUCCESS |
|
|
----
|
---- | EXPIRED |
SELL
PROFIT
DURATION
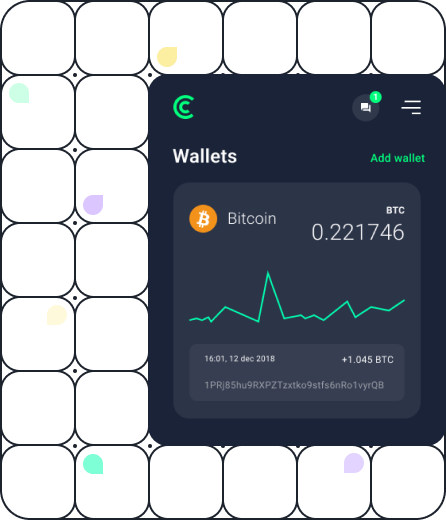
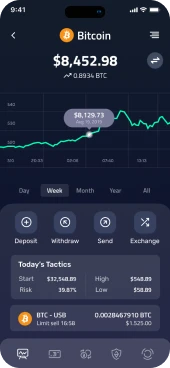
Build your crypto
Portfolio
Tralayzer is a fully automated trading machine that derives its power from a smart combination of advanced machine learning, deep learning, data science, economics, financial management, risk management, and Algo trading.
Explore CryptoBenefit from AI generated tools ⬆️
Tralyzer offers some innovative AI-powered tools that help both professional and novice traders make better decisions.


Trade with AI-powered system
Tralyzer helps traders open better positions and can even do it for them :)
Fire Zone Tool
Fire Zone is an AI-based thermal camera tool for financial market traders, helping them analyze support and resistance zones and understand overall market conditions. Key features include:
1. AI and Machine Learning: Fire Zone uses advanced AI and machine learning to identify key market areas, analyzing over 62 indicators and oscillators, and 30 chart patterns across six timeframes.
2. Support and Resistance Zones: It highlights important zones based on buy and sell orders and their impact on cryptocurrency markets. It updates these zones in real-time based on the market's reaction to the price movements of the previous 5400 candlesticks in six lower timeframes.
3. Supply and Demand Analysis: The tool also monitors large flows of crypto assets between hot and cold wallets, aiding in supply and demand analysis.
4. User-Friendly for All Levels: Both experienced and beginner traders can quickly assess congestion areas across different timeframes.
5. Color-Coded Zones: The Fire Zone indicator uses different colors to represent the strength of each zone: -Solid and Uninterrupted Colors: Indicate stronger zones and help in risk management. -Interrupted Colors: Suggest potential changes in the current trend, indicating possible bullish or bearish traps.
6. Timeframes: Useful for short-term and mid-term traders, Fire Zone can be applied to 15-minute, 1-hour, and 2-hour charts for trading strategy confirmation.
In essence, Fire Zone is a smart, color-coded trading tool that helps traders identify and react to significant market zones, thereby aiding in better decision-making and risk management.
Why Choose Tralyzer?
Tralyzer is tailored for those who demand precision, security, and profitability in their trading operations. With its cutting-edge technology, Tralyzer is not just another trading platform but a significant leap forward in automated trading
Customizable Strategies


Designed to meet the unique needs and risk profiles of individual investors.
Transparent Operations

Detailed reports and live position tracking through a personalized dashboard. Provides deep insights into each transaction, fostering trust and confidence.
Advanced AI Tools

Access to innovative tools for market analysis and trading decision support. Employs the latest advancements in AI and machine learning for a superior trading platform.
Say hello to : [email protected]
Follow us :


